Need to have a better insight into your GE Smallworld usage? Want to know what functionality’s used, for how long and how often? Want to know how many plots were made last month? Don’t know if it’s worthwhile upgrading your entire Smallworld implementation to 5.x? Our tool can help!
Now that we have done a few Smallworld upgrades, we all know it is not as simple as just recompiling your code in the new version. Just like with any major version, you need to look for deprecated methods, and in case you made any “core changes,” you need to reconcile them and check for compatibility. And honestly, who hasn’t done that? It has always been one of the strengths of the Smallworld platform. But with the limited (or almost nonexistence) of available source code in version 5, this can be a daunting task. This is where we can help.
We’ve developed a tool to help you analyze what functionality you are actually using.
You can easily install this in your existing application and let it run for days, weeks, or even months. All collected logs from all users will then be used with an interactive dashboard to visualize and analyze usage. Here’s an example:
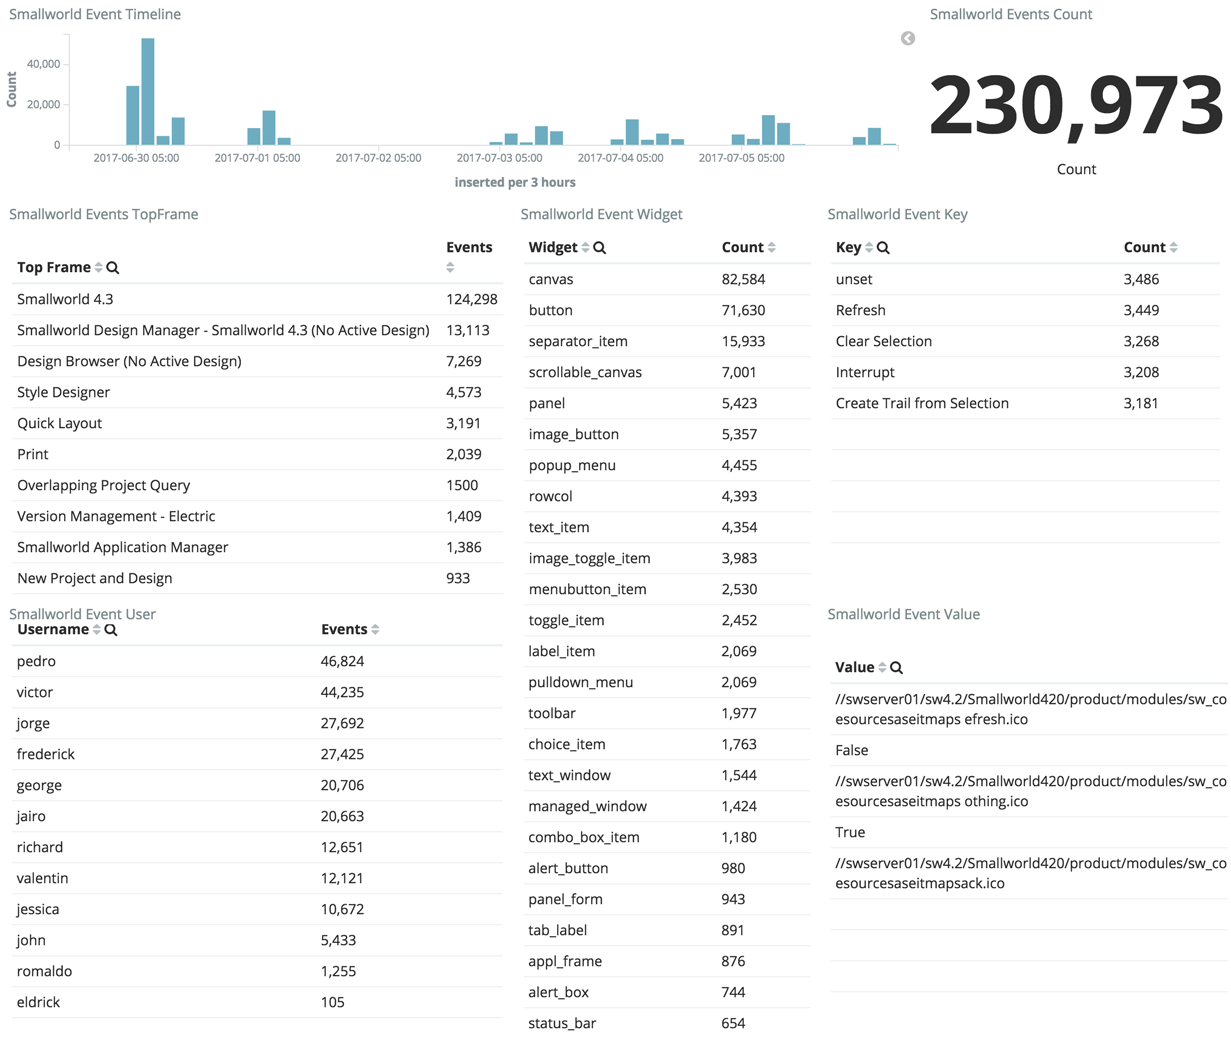
The top section shows a timeline and a total count of all “events,” such as mouse clicks. On the left are all the menus and users. And in the center and right are details about those. This tool allows you to drill down to individual buttons and other UI elements by clicking one of the menus on the left, which will then act as a filter. In the same way, you can also isolate certain users, as well as zoom into certain time frames: “Who plotted an A0 sheet yesterday?”.
When you let this run long enough so you can reasonably assume that all functions you will ever touch, will be touched. Then you can save yourself a lot of time by not upgrading the features that aren’t used.
Bonus: if you’re considering platform change, you can use this to determine the functionality you are going to need, accurately.