Screenshots

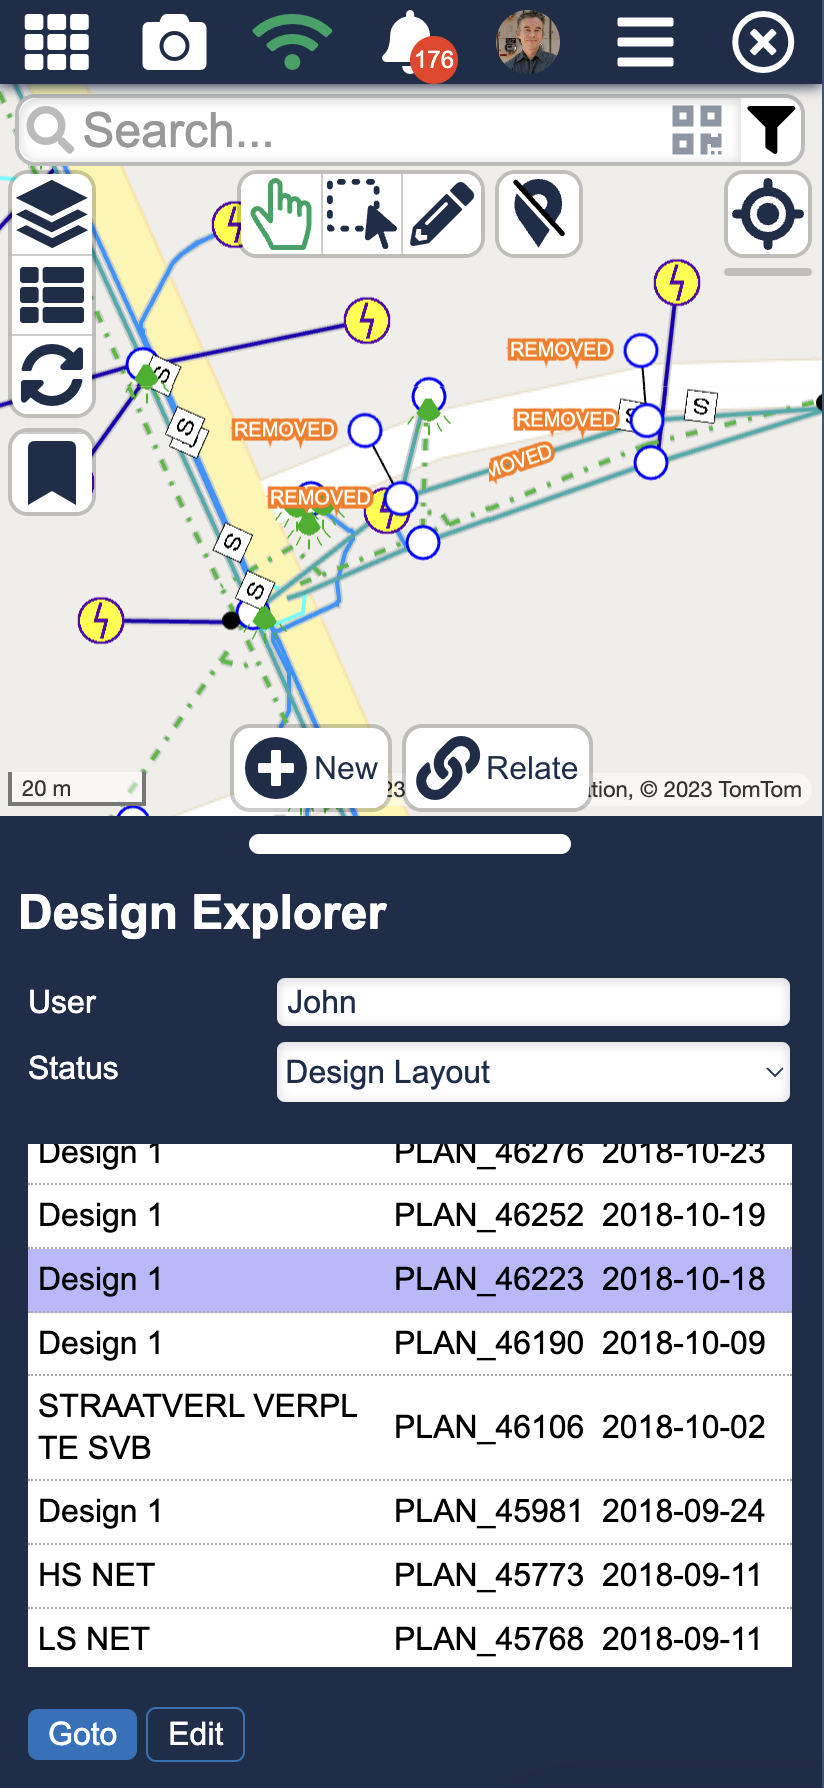
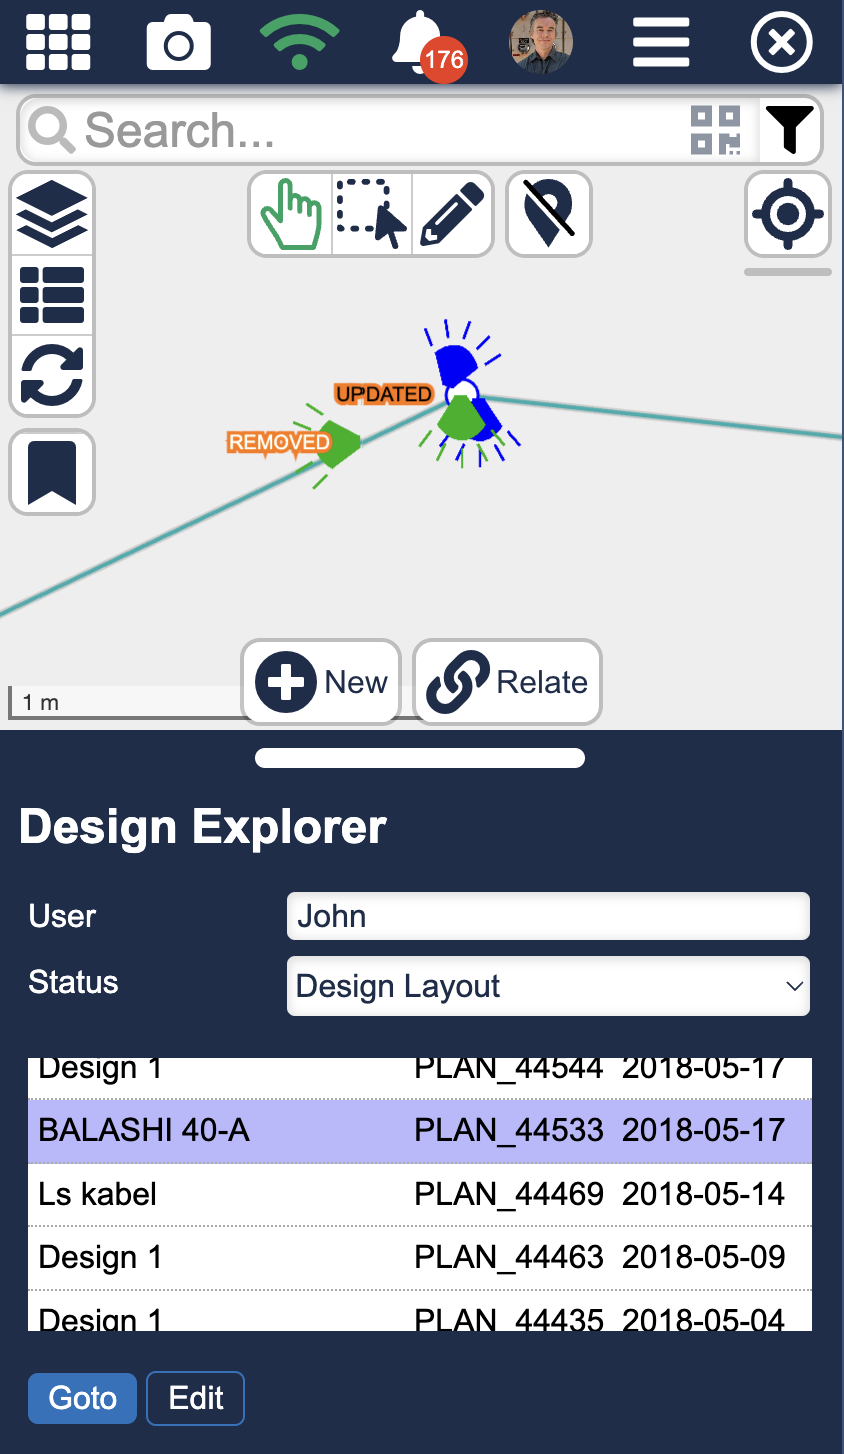
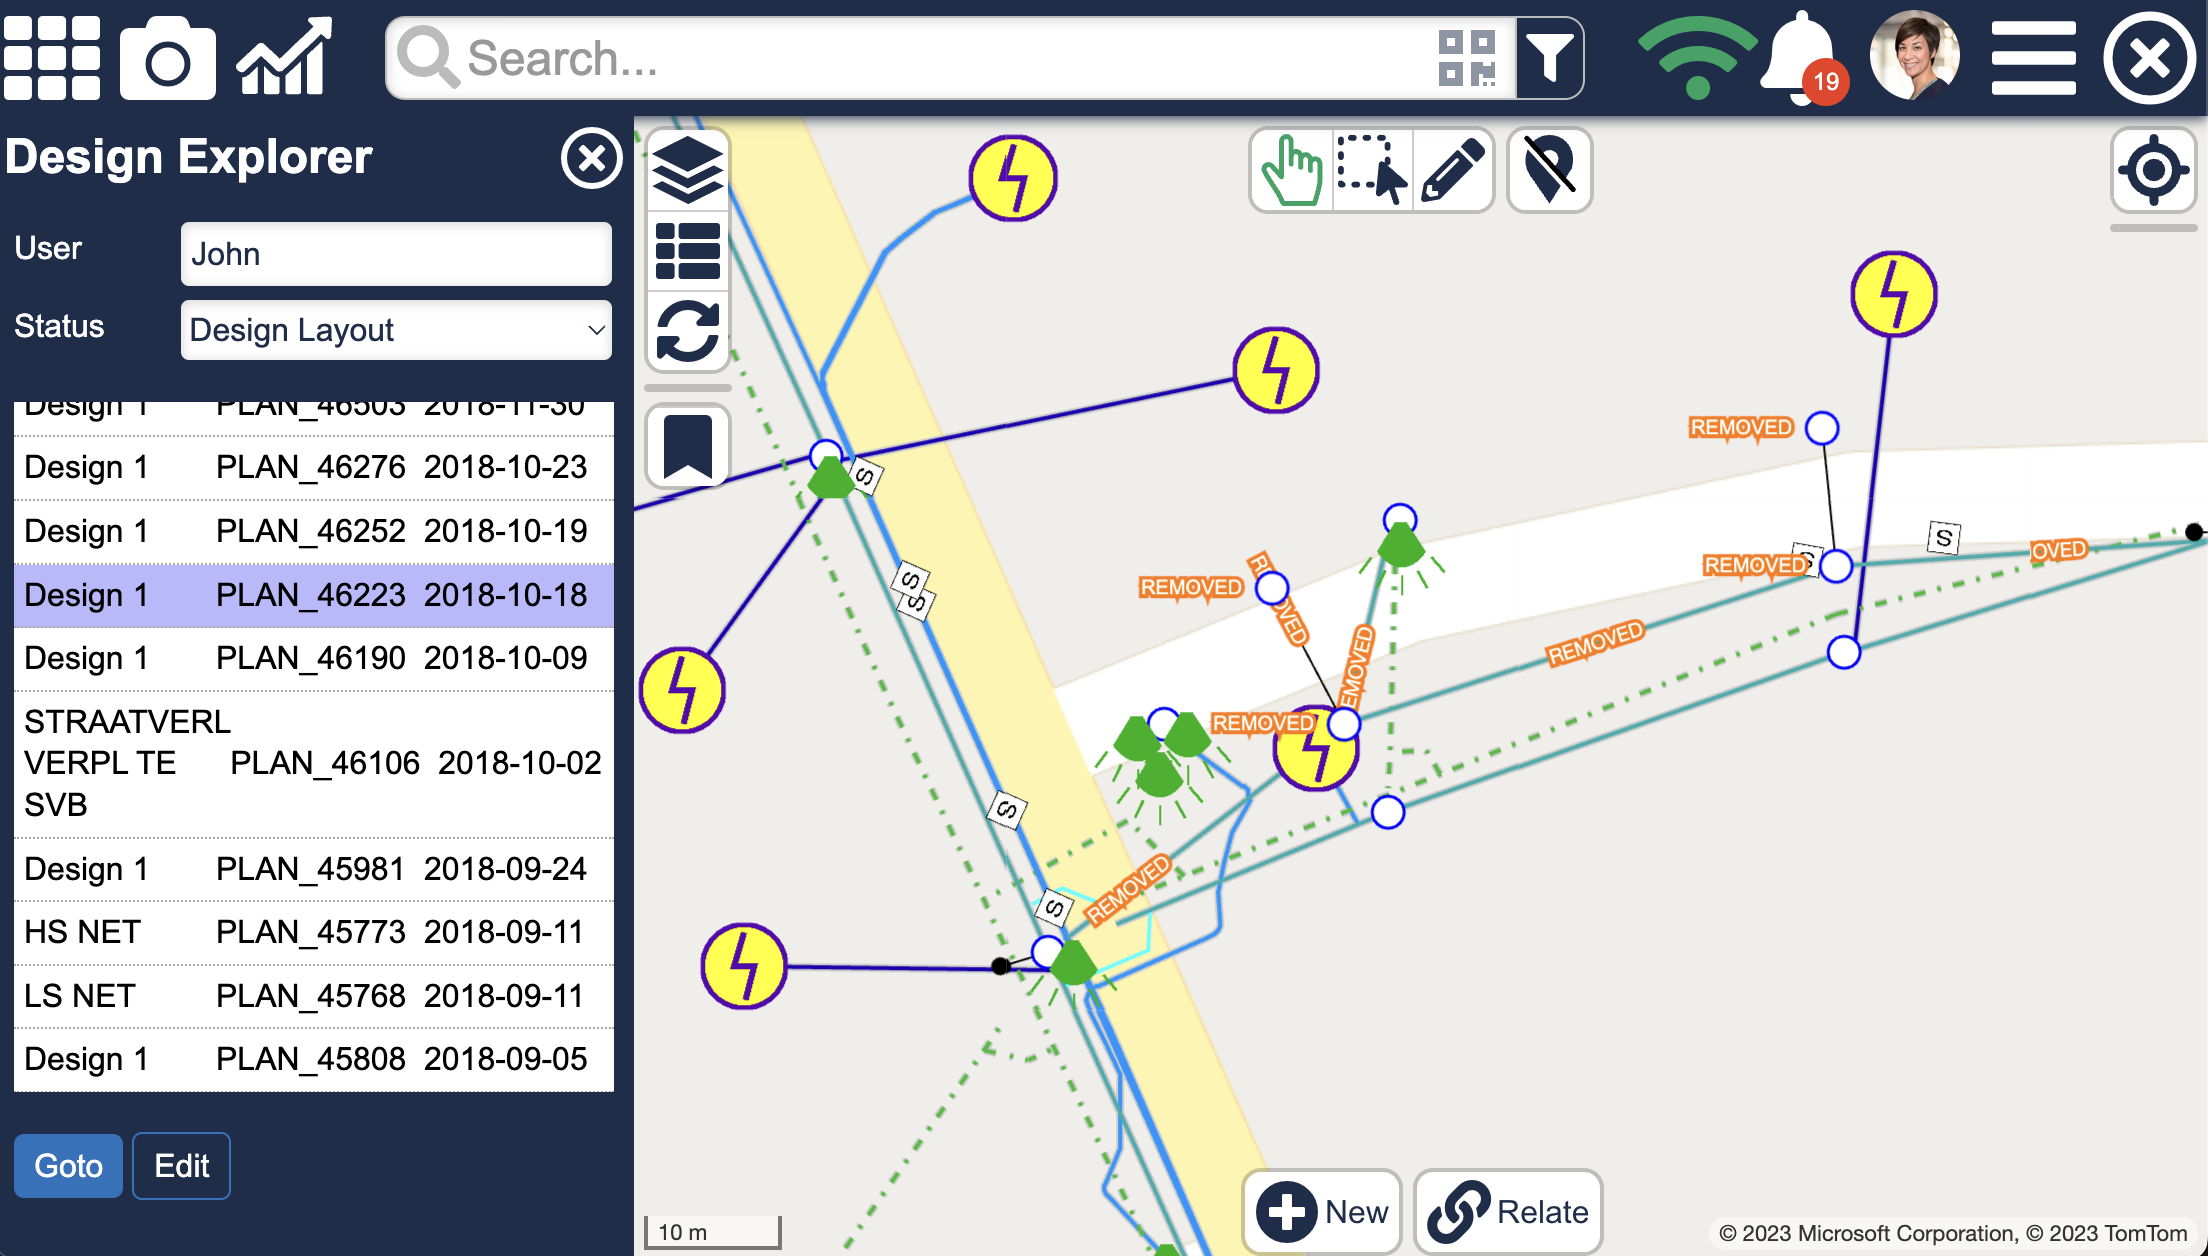
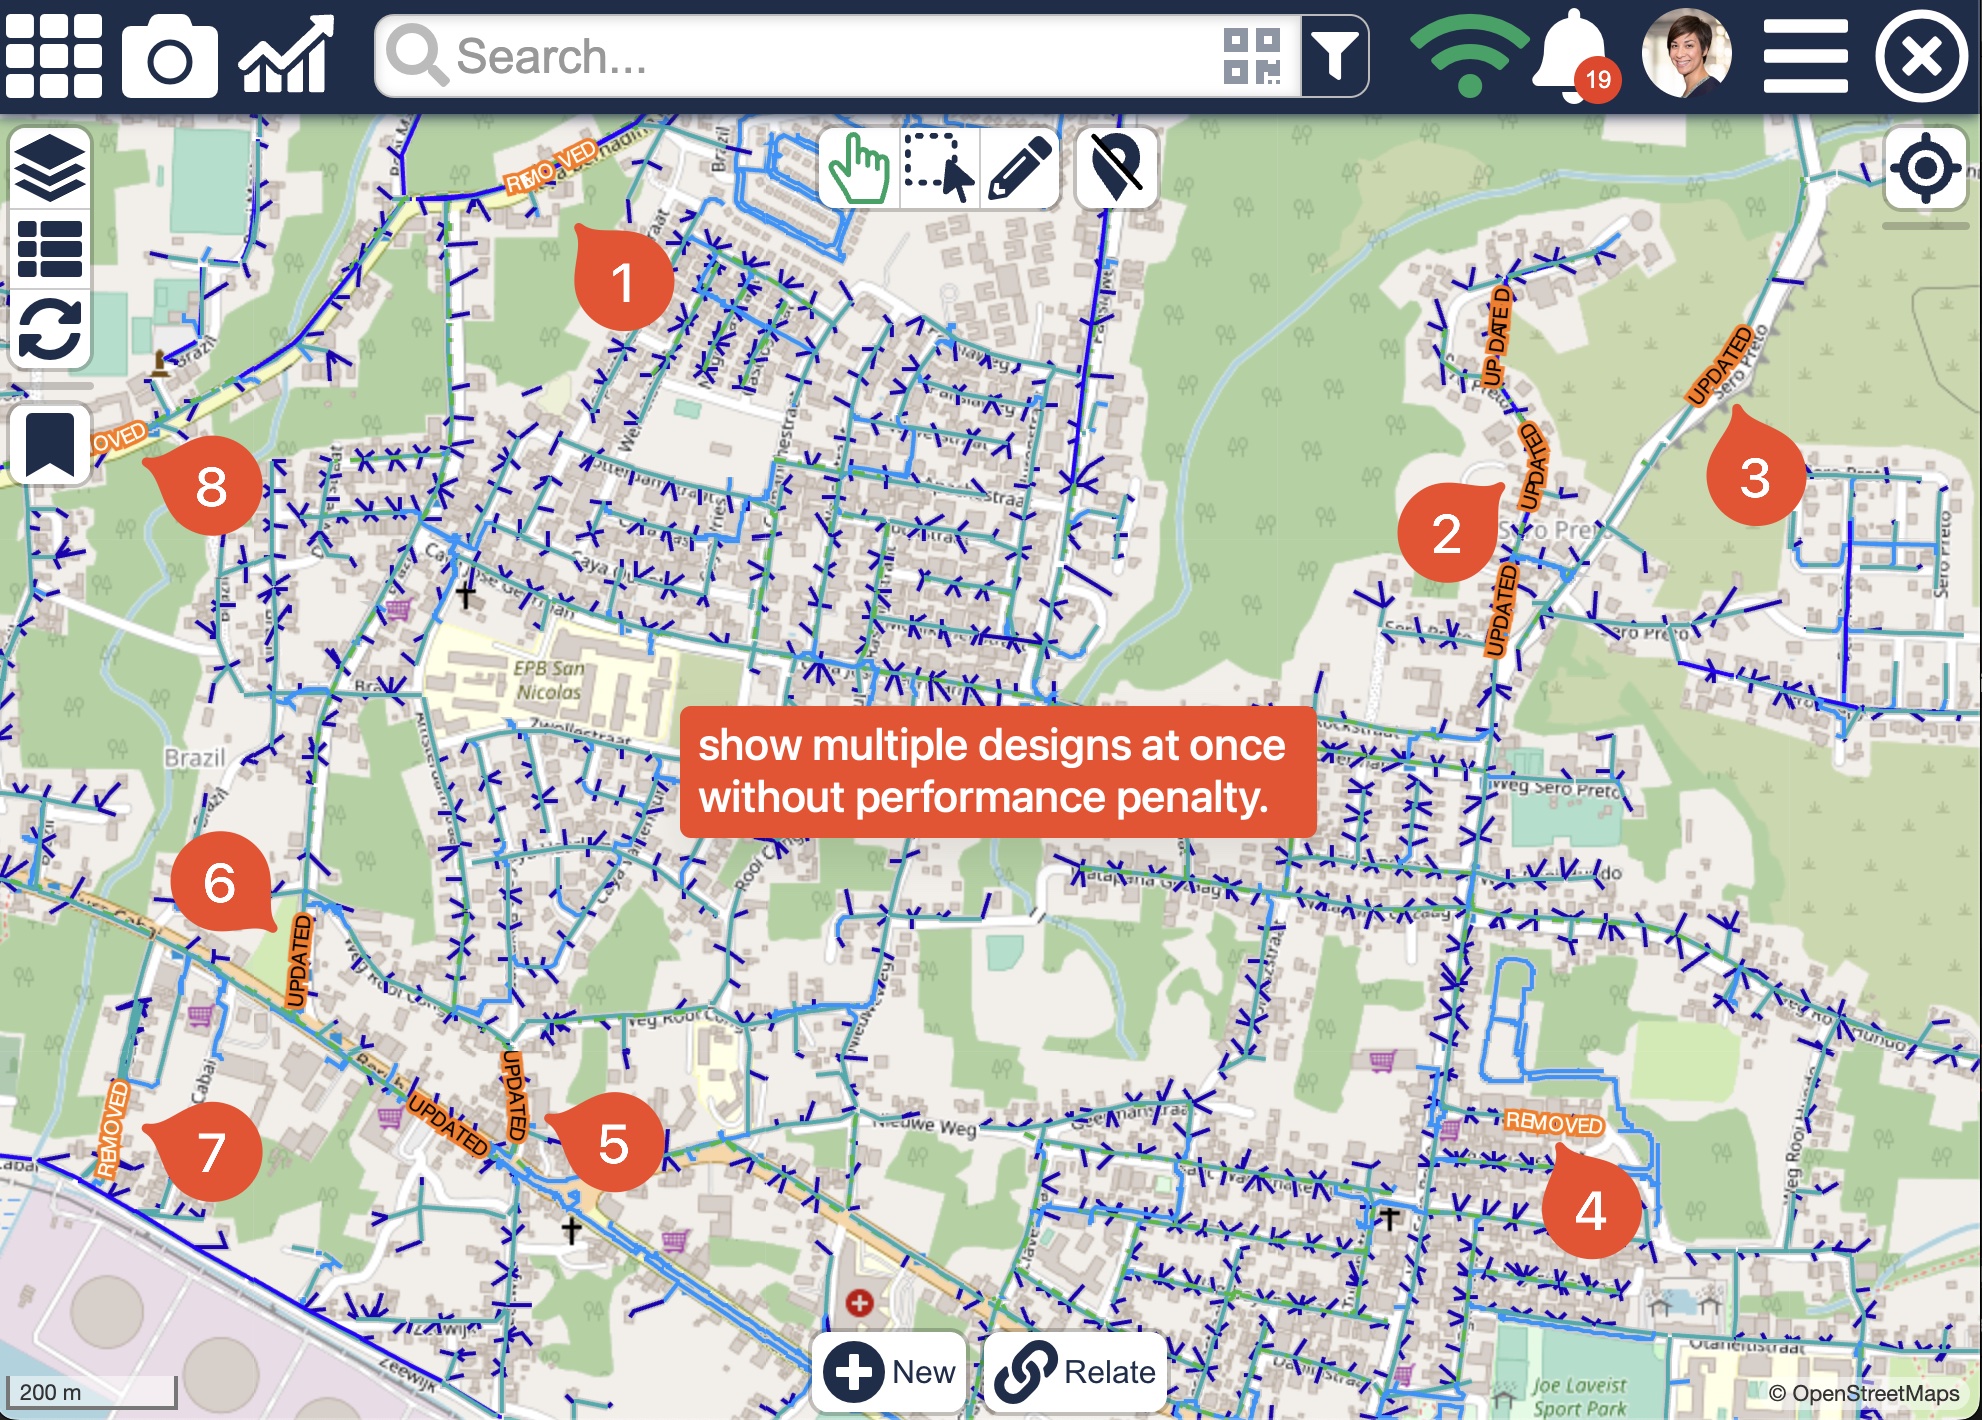
Designs
Version Management of data enables different designs to be loaded on the device or be viewed in a browser and switch between them instantly.
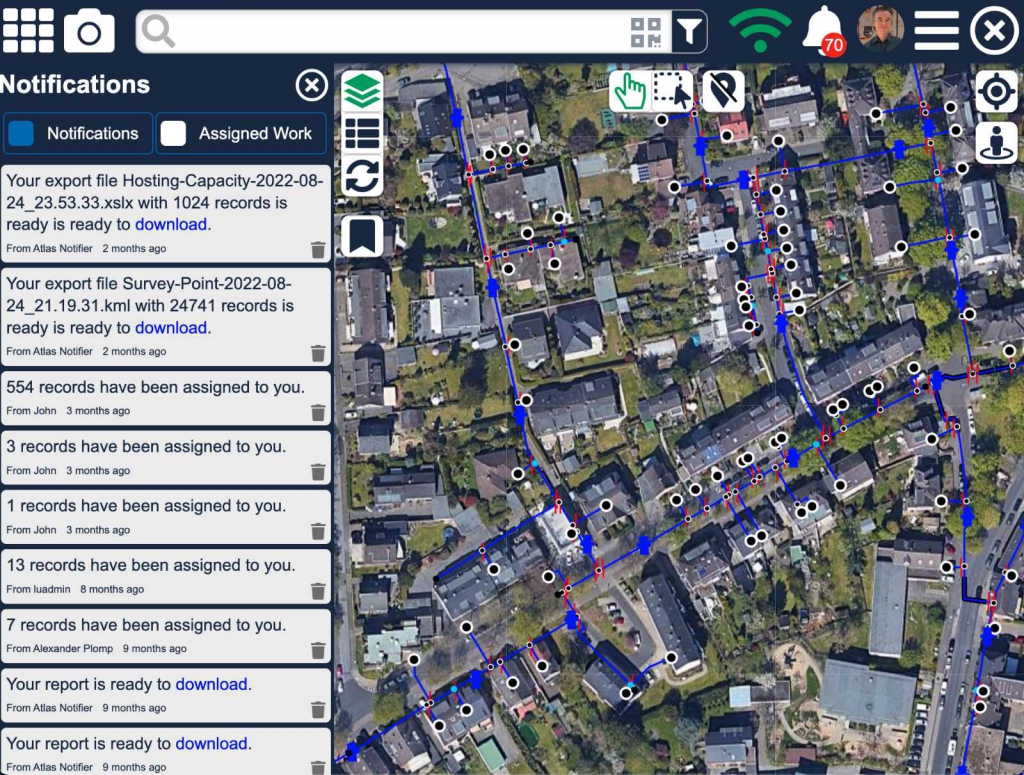
Push Notifications
User receives push notifications (left) when work has been assigned, exports have been completed, plots are ready for download., etc.
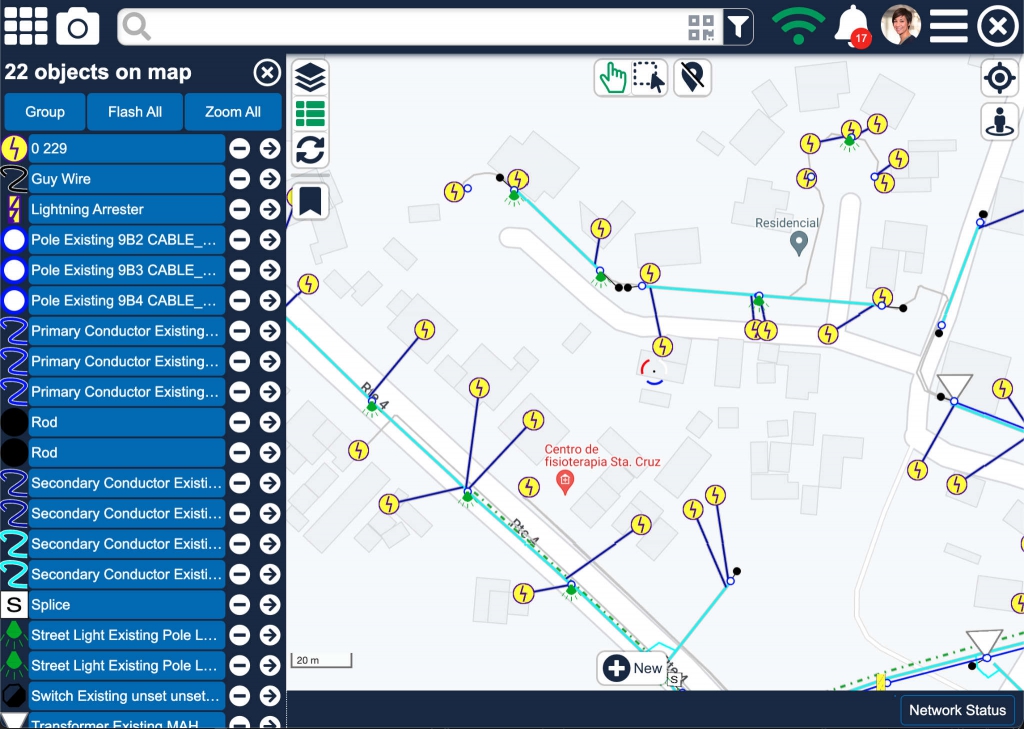
Vector Data
Vector data not only provides great map details, but also significantly simplifies administration. ESRI, GE Smallworld and many others. Updates are available in real time when connected.
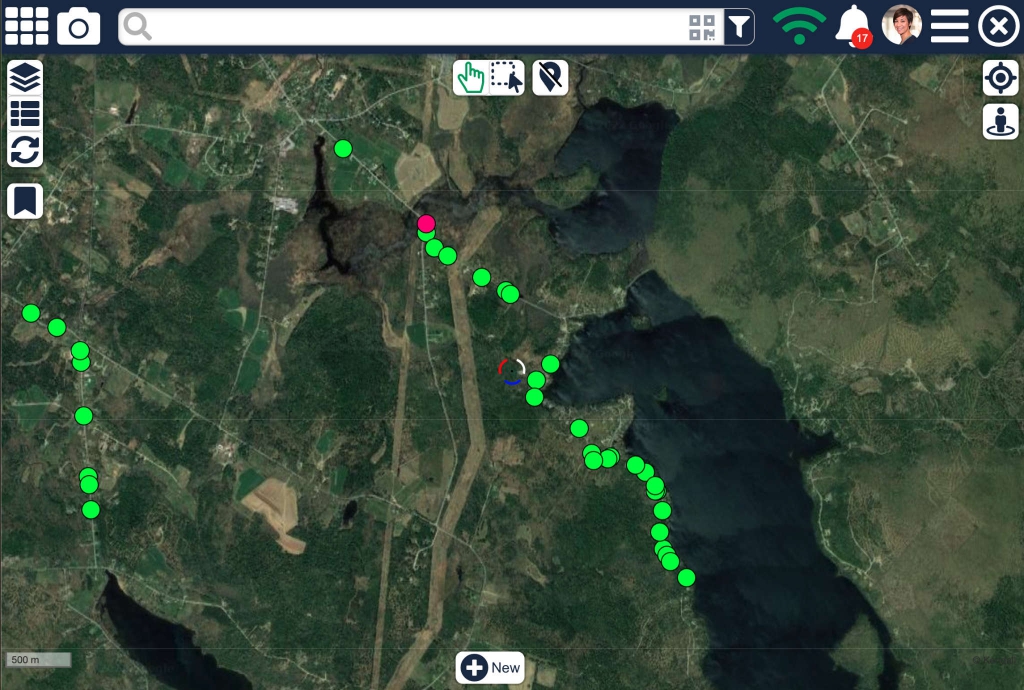
Background Data
Street, Satellite or Hybrid. Bing, Google or Open Street Maps. Many others available. Third party layers like weather, crime data, etc. can be enabled.
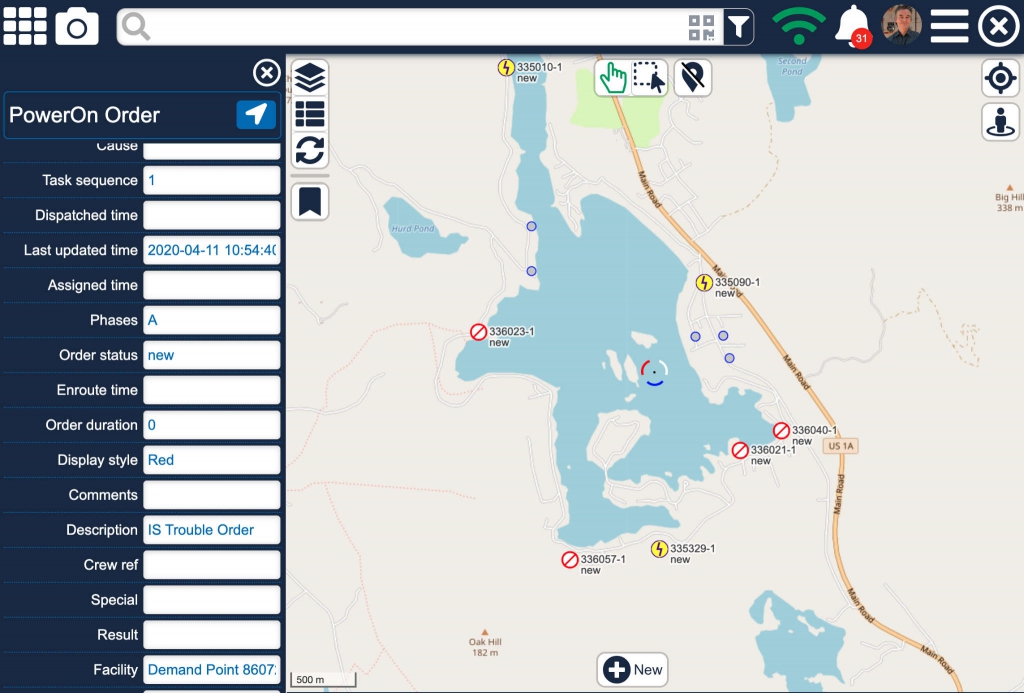
Outage Data
Live Outage data available for field users! Historical data remains available as well. Shown here is data from PowerOn.
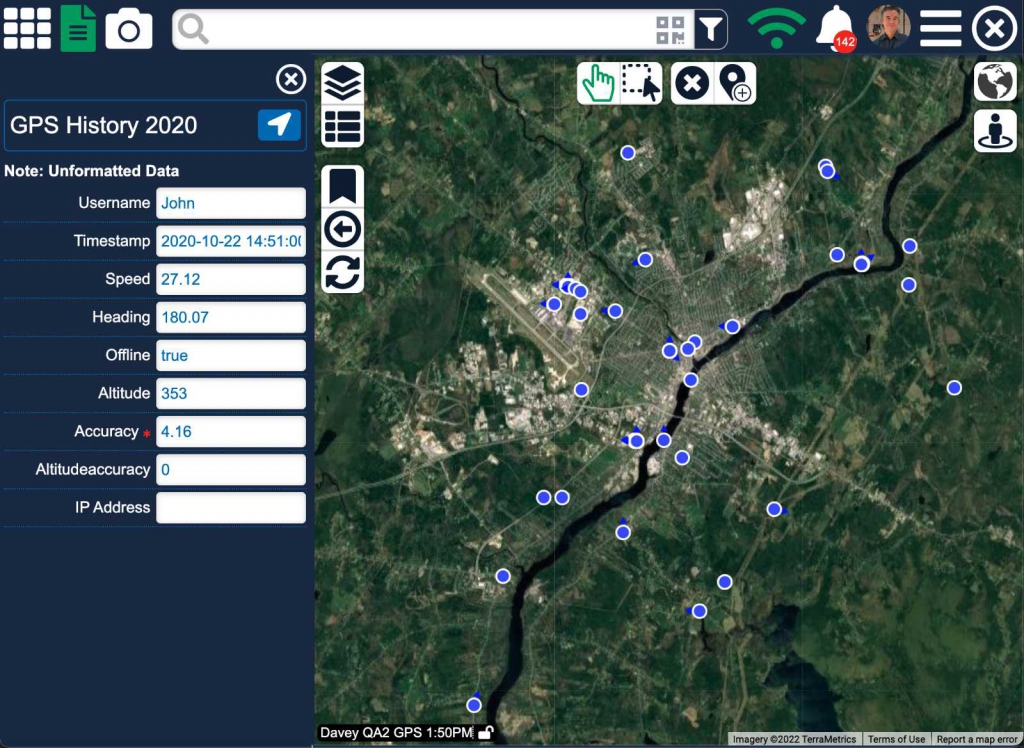
Crew Location Data
Crew Locations shown on the map. Details and historical data such as bread crumbs are available.
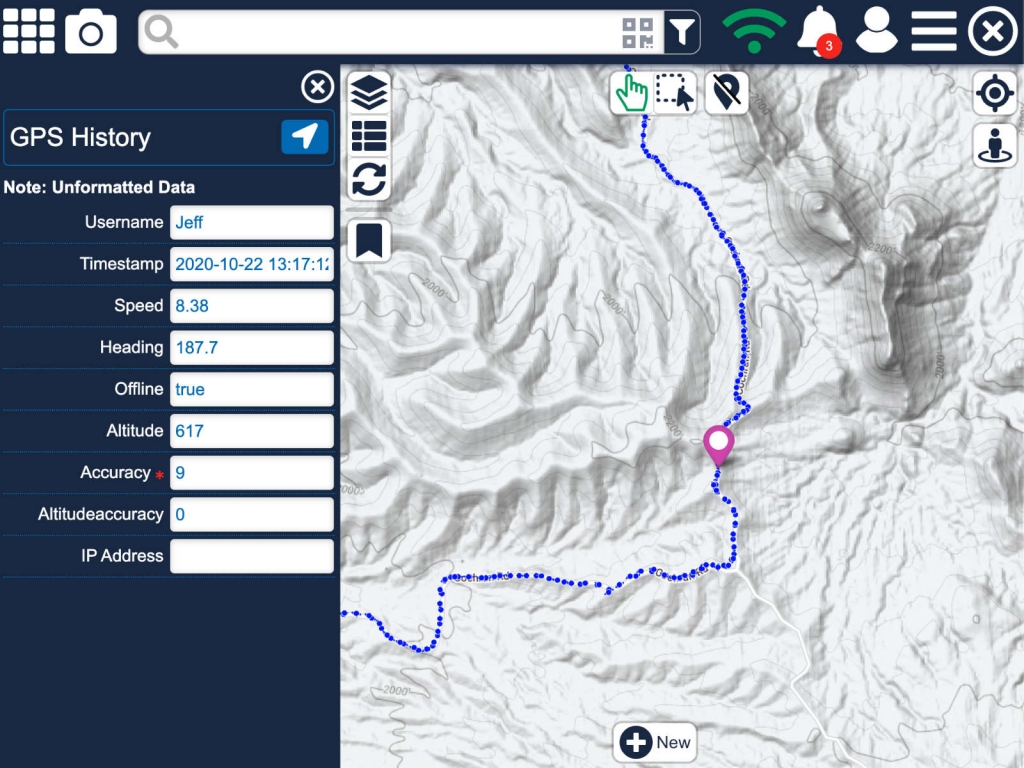
Bread crumbs
Bread crumbs as shown here while doing an automated driving survey where objects are marked surveyed automatically when vehicle is within acceptable radius.
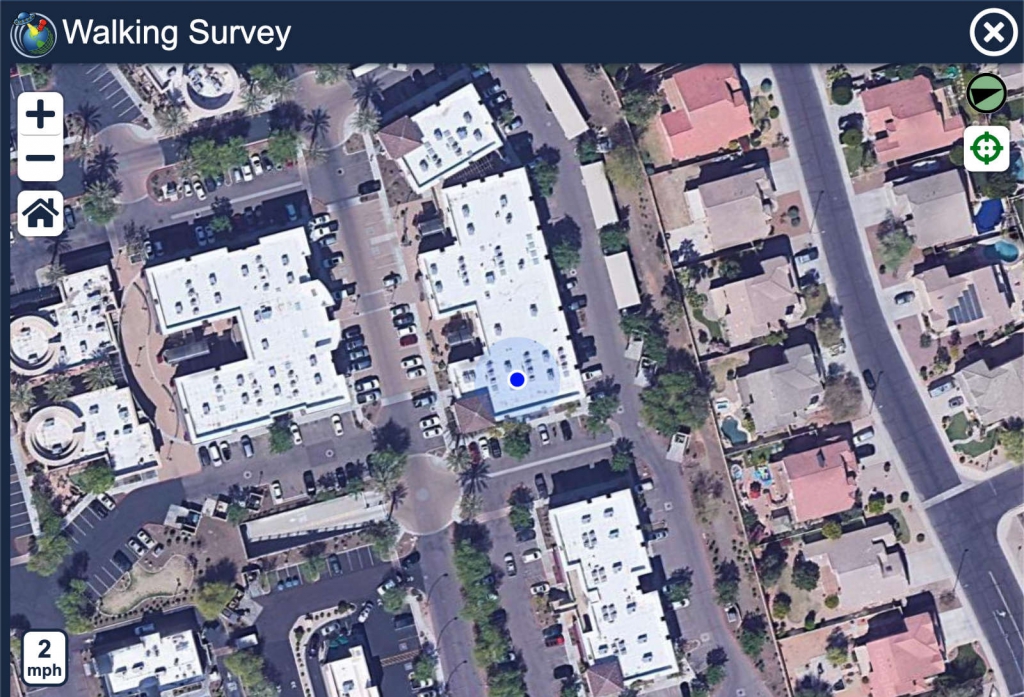
Map Rotation
Map can be rotated manually, or automatically depending on driving or walking direction. Useful when doing surveys. Note the north arrow on the top right of the map.
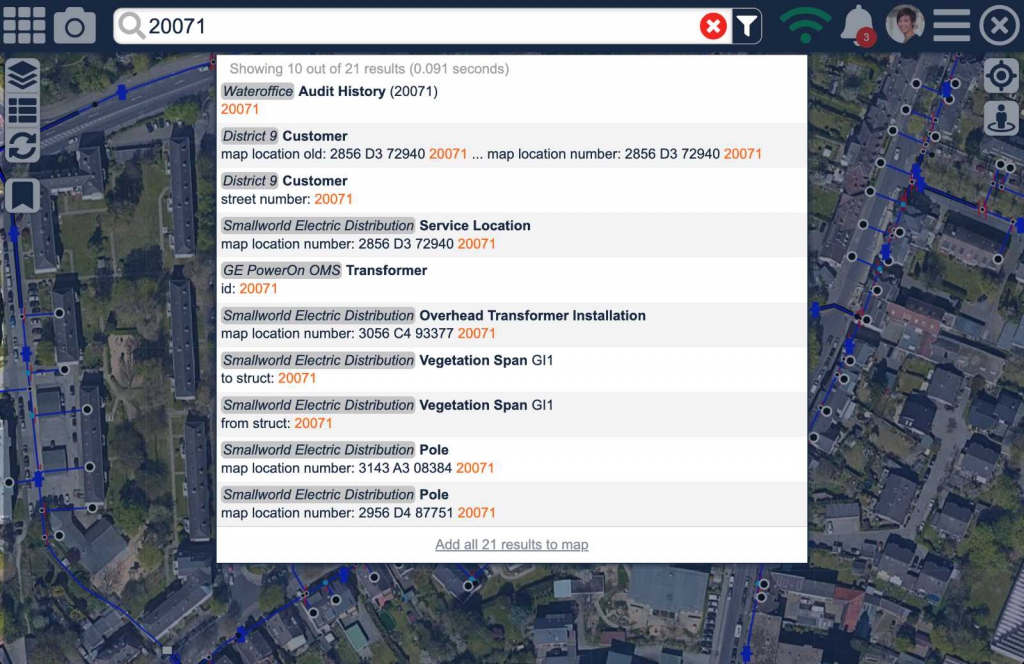
Search. Simple.
Find anything you need without specifying what you are looking for. Just like Google and Bing do. No need to indicate that you are looking for a pole with ID 123. Just search for 123. Suggestions (‘Did you mean’) and ranking.
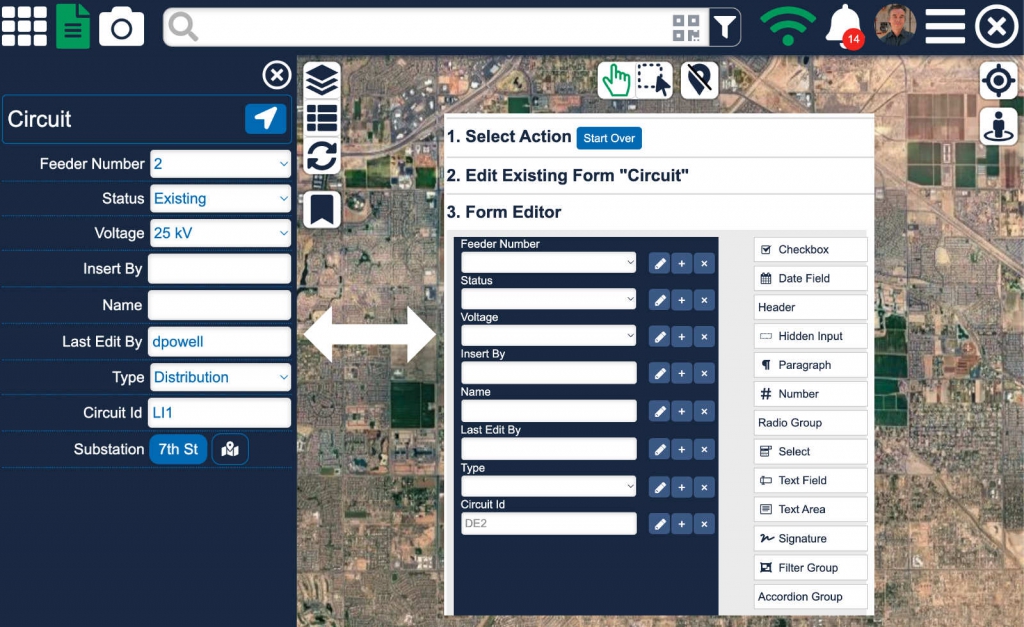
Forms
Configure forms for surveys, inspections, assessments. Use drop downs, radio buttons, default values, mandatory fields, invisible fields. Define form status and work flow. Force user to follow a specific flow and use color coding. Button (status) color corresponds to asset color on the map. Thick circle around the asset indicates it was assigned to the user currently logged in.
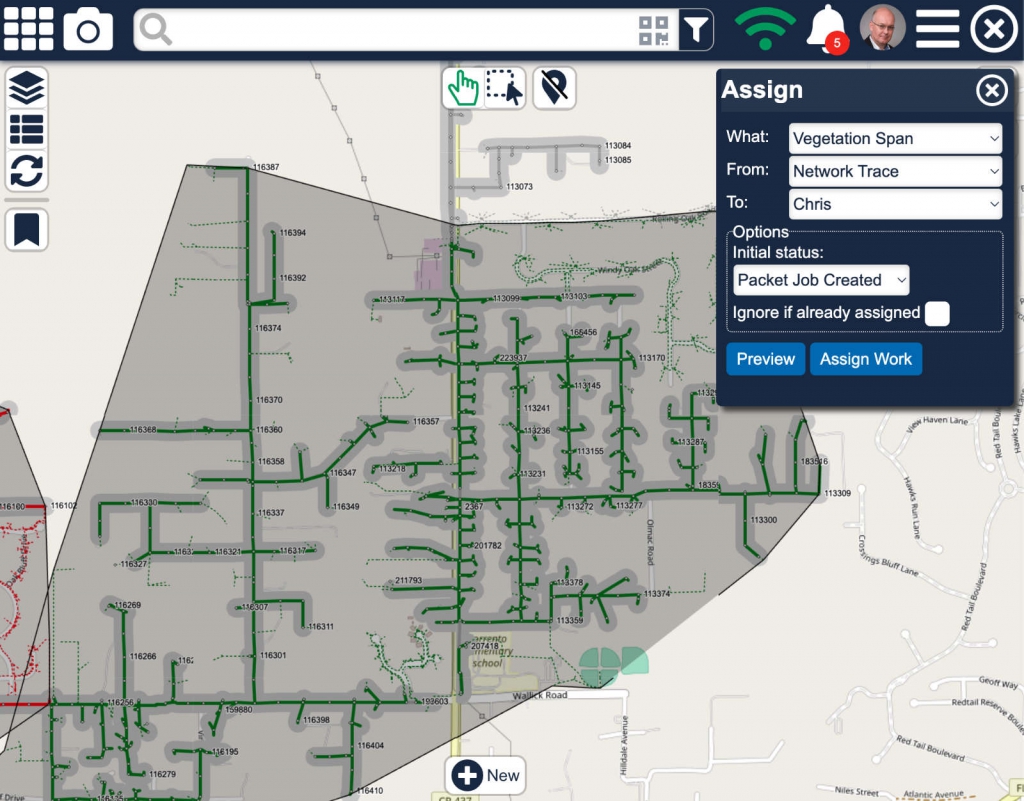
Work & Job Assignments
Define work to be done by simply selecting objects on the map, search, use trace results (level of effort) or inside a manually drawn or predefined area.
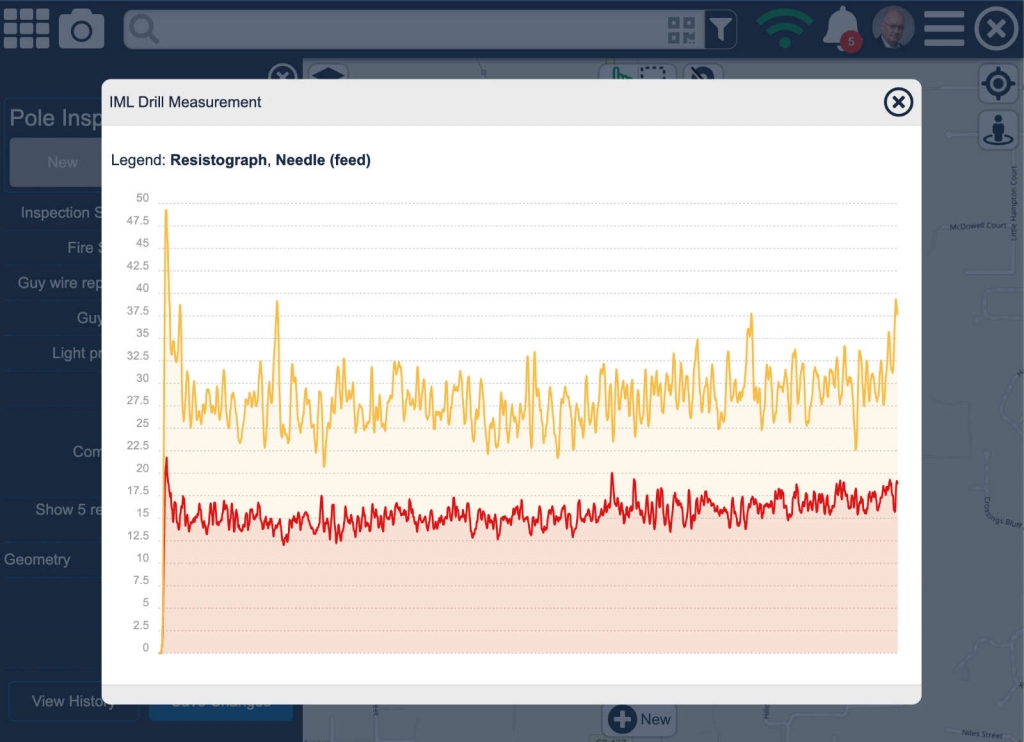
Bluetooth Integration
Bluetooth Integration with third party hardware such as sniffers and resistographs.
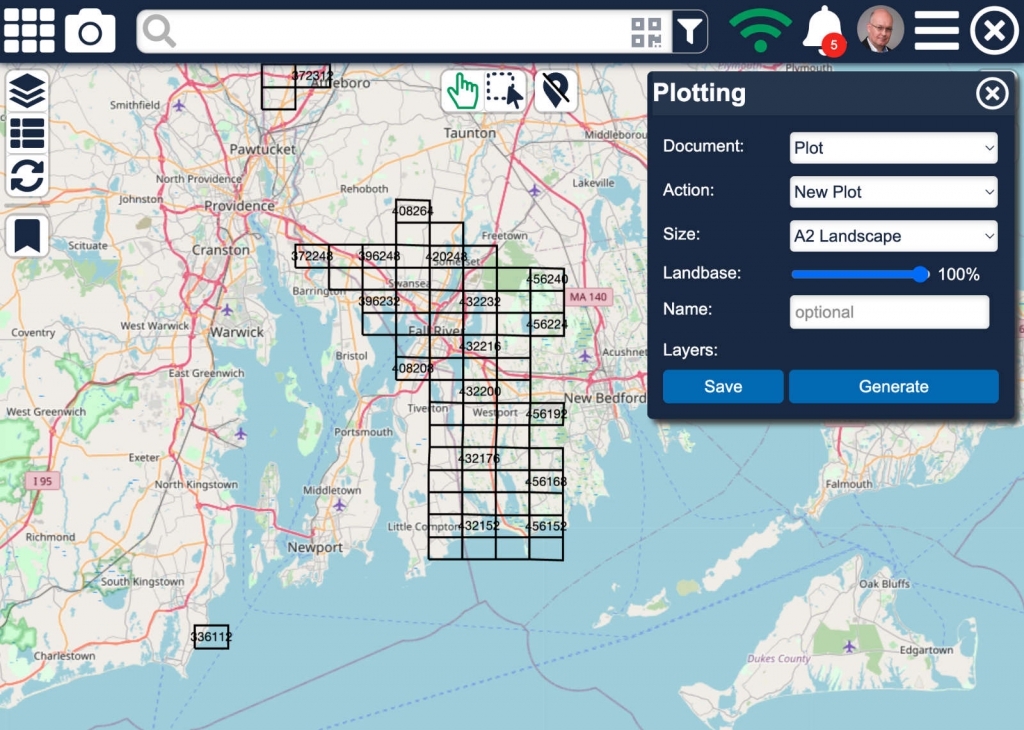
Plotting
Plots can be created in different sizes, preferences saved and recalled later. User receives a push notification when plot is ready for download.
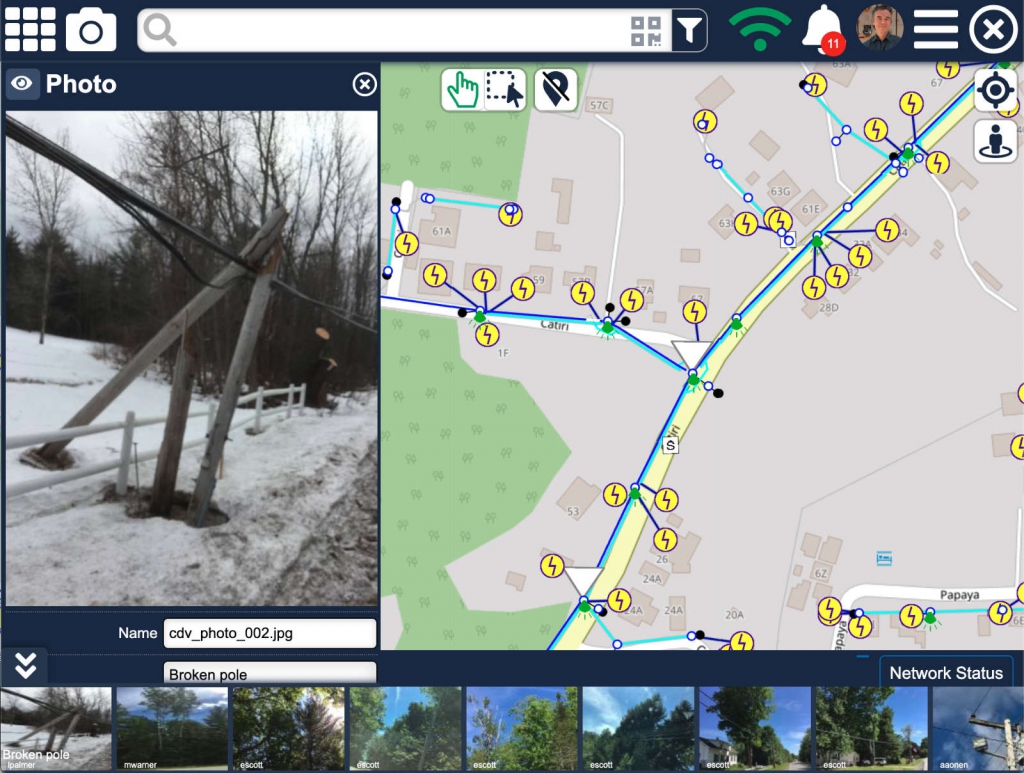
Photos & Attachments
Photos and other type of attachments can be associated to a location on the map or associated to an asset. Clicking on the attachment icon opens the picture or document.
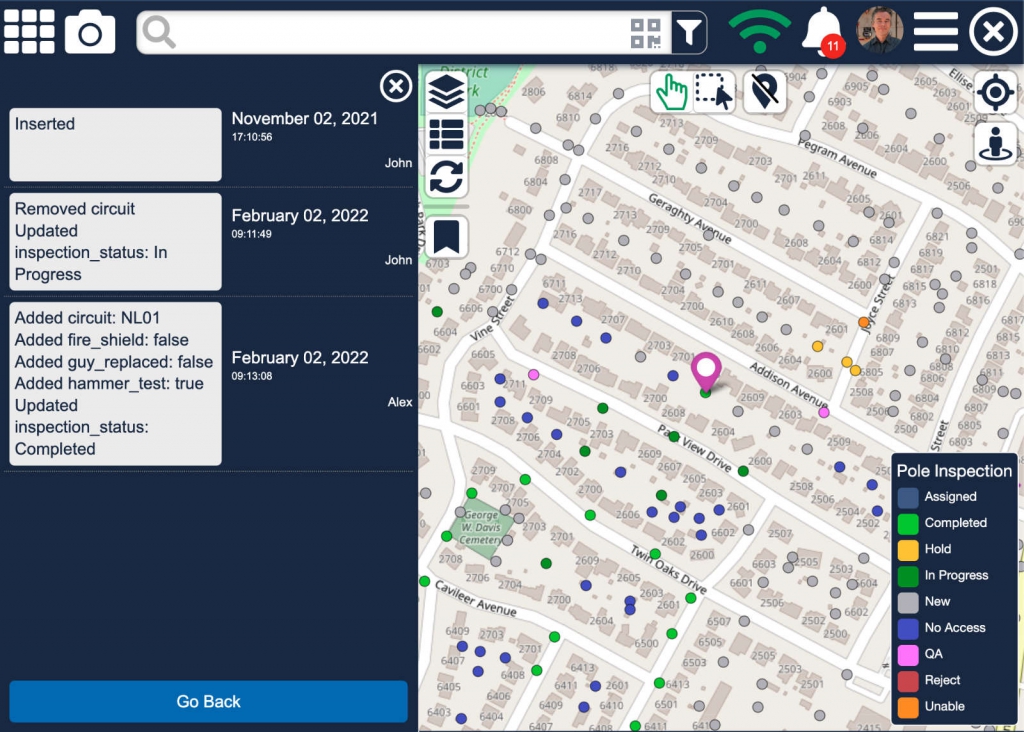
Audit Trails
Left side shows full audit trail of who did what to what asset or inspection. Exact details are recorded and available for audit: who, when, what and where.
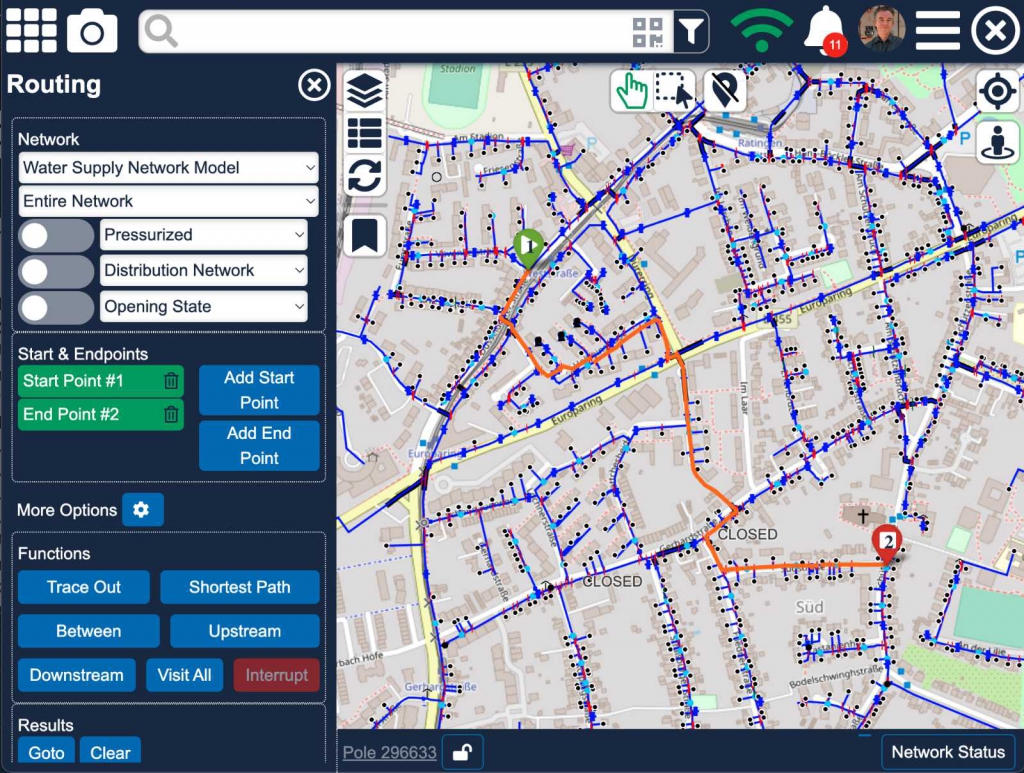
Tracing
Tracing is supported in both offline and online modes. Shortest path, upstream, downstream and stop criteria (i.e. open circuit breakers or closed valves) can be set. Shown is a shortest path on a water network.
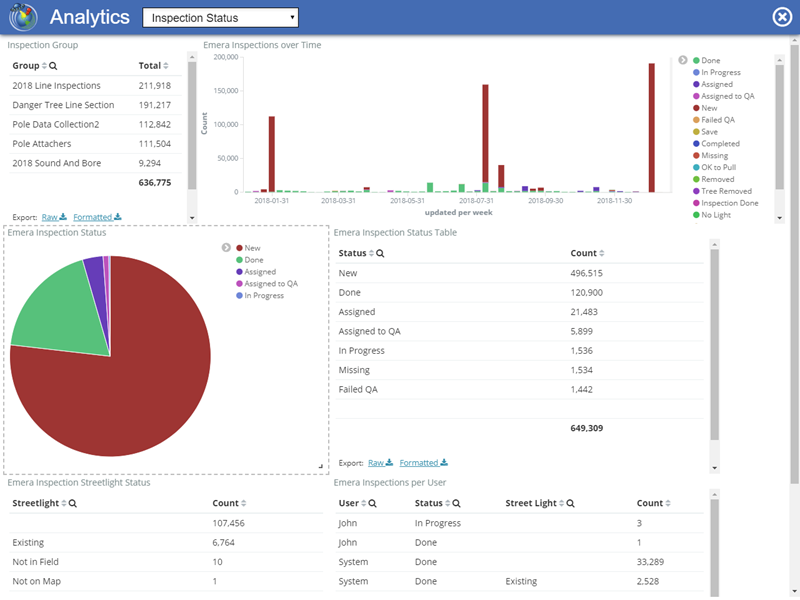
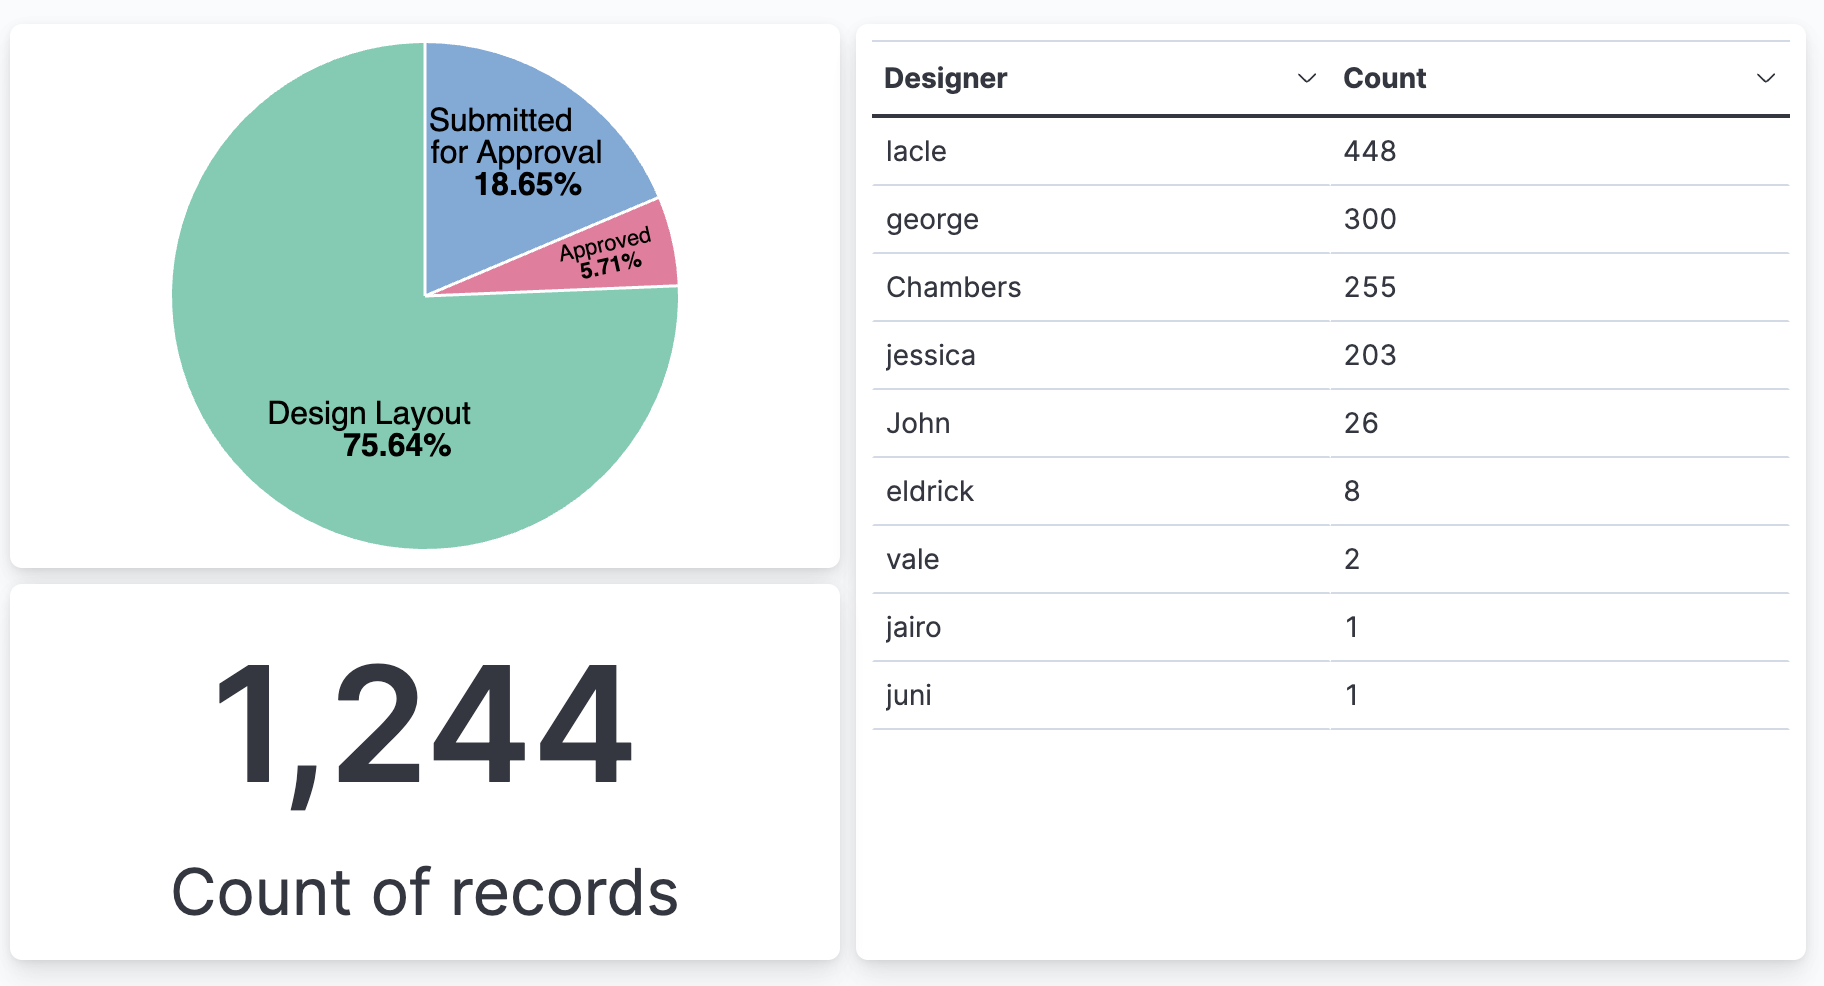
Dashboards
Example Dashboard showing inspection statistics. These dashboards are updated in real time.
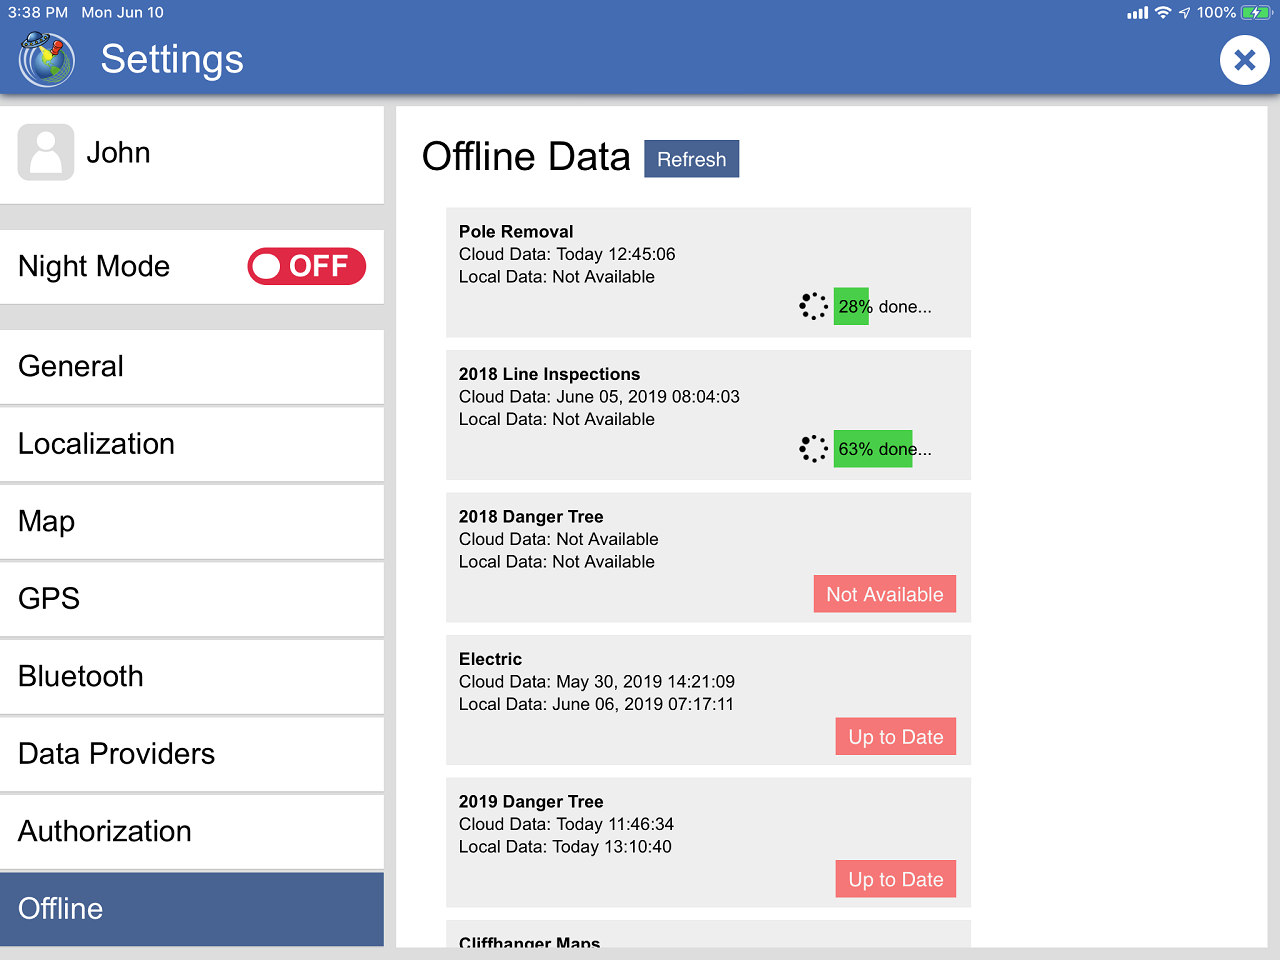
Offline & Online Data
Offline data being loaded onto mobile device. Since the data is vector data, this process only takes a very short period of time. User receives a message when new data is available for offline use, but will always have the latest data when connected. Which data(sets) and what area(s) are available for offline use is specified in a simple admin menu. Offline databases are kept up to date in the background.