Thematic maps are a frequently requested feature: Group map elements together based on certain attributes. One example is to color code (electrical) circuits on a map, showing by color what is connected. This enables a user to identify which sub stations are feeding a circuit quickly. But no two customers are the same, so we at Cliffhanger thought about how to “color code” your map based on any attribute or even a combination of attributes. Because, why limit yourself to 1 or a few baked in themes? So we implemented a combination of “filtering” and “coloring”. This is how it works: First, this step is optional, the user can filter data on the map.
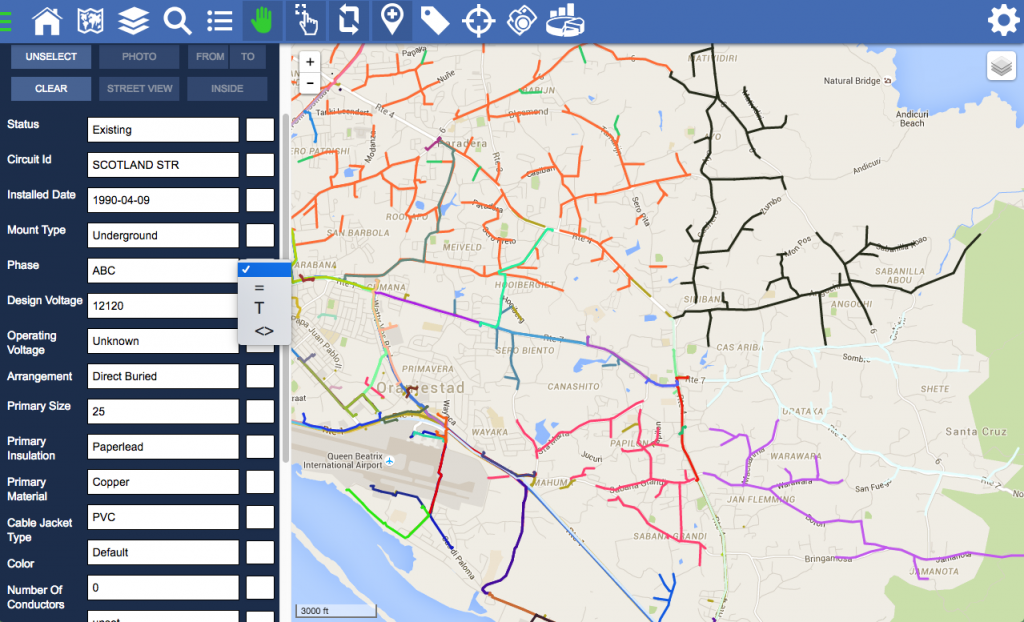
For example: show all “Underground, Copper” cables only. Then, you can color code your filtered data based on other attributes such as group them by “Voltage” or “Work order status.” In this case, each “Voltage” or “Status” gets its own color. Everything can be done with a few simple clicks. This allows the user to quickly explore and analyze data in many different ways. This feature is currently in Beta and will be available in an upcoming release.