We were asked if we can provide better information to utility customers regarding outages. The goal was to provide more accurate estimates, thus improving customer service, and avoid or minimize situations like this:
We fed available historic information from GIS and OMS into a machine learning model. While not “big data”, more than a 100000 individual incidents were enough to feed the model and detect trends and anomalies. Over time, we will add more data sources, such as seasonal weather patterns, to improve accuracy.
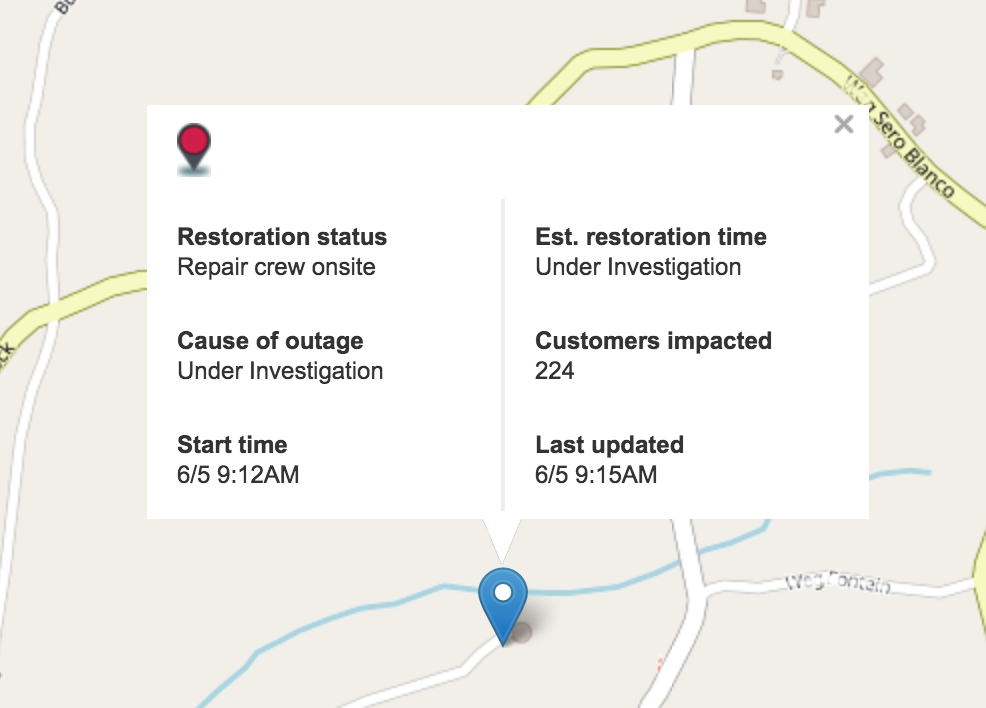
During an outage, new information trickles in as time progresses, so the model must be able to handle “incomplete” information. For example, initially only a single smart meter might ping its status. A customer might call in the outage. Later, a crew arrives on site to investigate the outage. In the meantime, an OMS might predict certain equipment failure. Solving this using a traditional rule based approach quickly becomes too complicated so this is where ML comes in.
Initial results look promising and we are using this internally first to gain more insight and understanding. When we’re confident enough about accuracy and false positives we will make this atlas extension available to our public facing utility customers.