Intro to Map Tiles
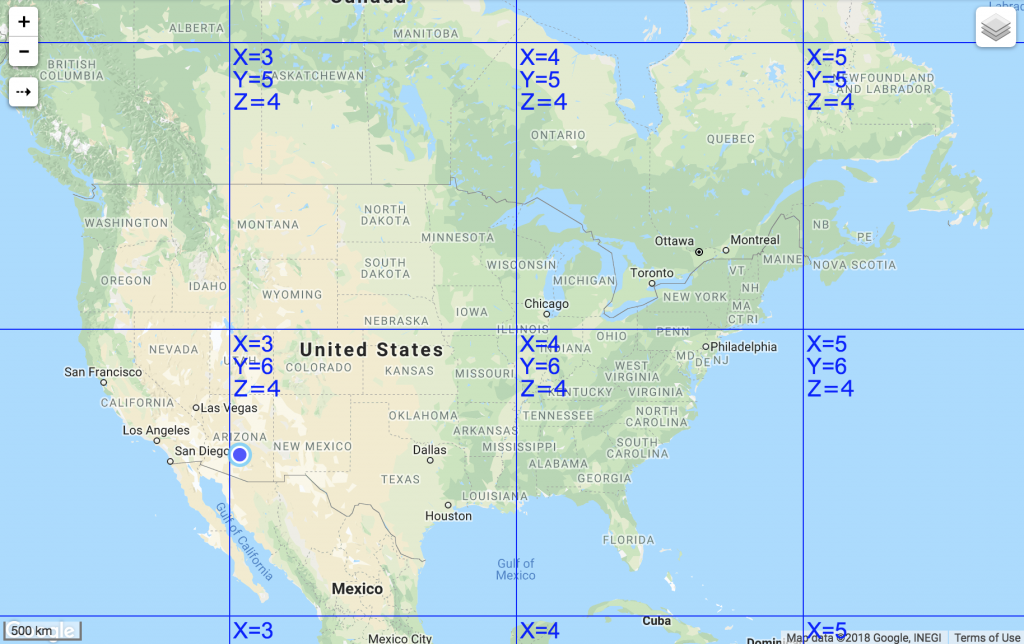
Map tiles are used to show background or other data layers that need to be fast. Instead of rendering the whole viewport from scratch each time a zoom or pan takes place, map tiles show a mosaic of small images (typically 256×256 pixels) to build the whole viewport. Each map tile is fetched from the server and each zoom level has its own tiles. Map tiles are typically pre-rendered on the server and cached to provide high performance for the client. Google Maps, Bing Maps, and others use map tiles in one form or another. The image below is such an example.
The benefit of having a fast map comes at the cost of having to pre-render each tile beforehand. This can get quickly out of hand as each additional zoom level quadruples the number of tiles. If the area you want to cover is large you quickly end up with millions (or billions) of tiles, requiring disk space and upkeep.
If you need to display data that changes a lot or is more real-time in nature, map tiles need to be constantly regenerated, requiring lots of CPU and storage. And in reality, most of this might never ever be visited.
Another disadvantage is that if you need to change the map-style or add/remove features from the map layer, the whole layer needs to be regenerated.
This made us wonder…
Google Maps Licensing
In June, Google changed it’s licensing structure for Google Maps. This mostly won’t affect light users, but heavy Google Maps users can expect a steep cost increase. See this article.
As a precaution and as an alternative to Google Maps, we are introducing “Cliffhanger Maps”. Enjoy unlimited use without unexpected sticker shock, download on your local device for offline use while avoiding pay-per-click and a ton of legal mumbo-jumbo.
Cliffhanger Maps
Cliffhanger Maps is an alternative to Google- or Bing Maps. Our goal was to provide a pleasing looking land base with a color scheme that supports but not overpowers your own data layers.
How did we do it? See top image.
- First of all, our maps are not raster based but vector based. The top left corner of the image shows the “raw” vector data with no styling applied.
- Then we developed a style system to give the raw vector data a specific look and feel. These styles are simple rules that can be written in a text file. This is somewhat similar to HTML pages that can be styled with CSS.
- When it is time to render, the vector data is fetched from our search engine, after which the styles are applied. The result is in the bottom right corner.
- Since all data is rendered as a vector, the image is always crisp. Symbols are scalable vector graphics (SVG) as well. For retina displays, we render at double the resolution for incredible crispness and detail.
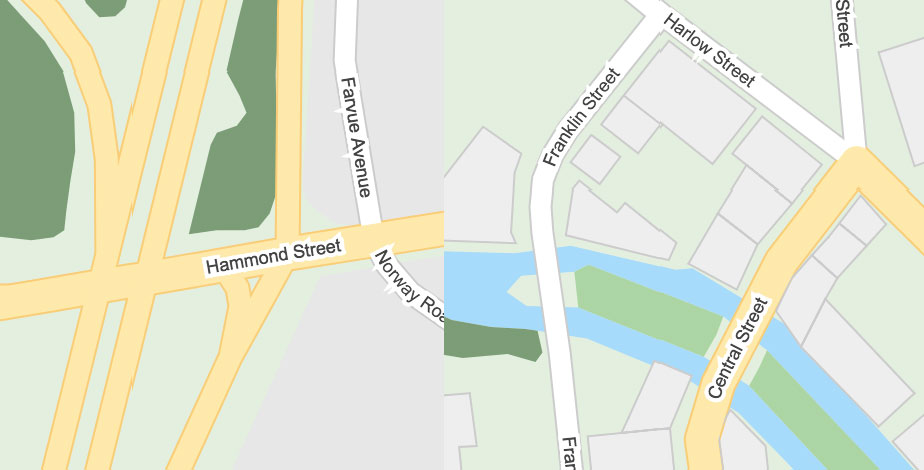
Below is an example of zoomed in details. Note how streets connect with each other, bridges look correct and how text can flow with the street that it belongs to.
The performance is so good that we don’t need to pre-render data at all. This has a number of huge benefits:
- No need to store millions of image map tiles on the server
- Map tiles will never be stale as the map is always rendered from the data source in real time.
- You still have the option to cache the data, storing them in “vector tiles” which are very small.
- Actual rendering can take place on the server OR on the client. This allows for easy offline use.
- Changing the look and feel of the map is as easy as swapping out a style sheet. For example, you can have a dark theme for use at night.
- Unlike Google or Bing, we can customize the look of Cliffhanger Maps tailored specifically to your needs.
- No need to cap the maximum zoom level to save space and processing power.
Cliffhanger Maps is hosted on our fast AWS servers with (optional) smart caching and is available as a WMS or a WMTS (Vector Tiles).
Advanced use cases
Since all the land-based data is stored in our own search engine, we can answer more complicated questions easier. For example:
- Give me all transformers within 1000ft of a fire station.
- Since we also have access to traffic light locations, we can optimize routing to avoid streets with lots of lights.
- Or how many poles are located in a forest?
All this with a single search, without having to call 3rd party API’s, then combining the results.
What’s next
In this article, we discussed land base data. However, the algorithms behind Cliffhanger Maps are not limited to this and can be applied to client data layers as well. Over the next few months (weeks?) we are migrating all our clients away from raster maps tiles with the exception of satellite imagery. For example, clients that use Smallworld GIS to show utility data no longer need to run a server farm with expensive Smallworld licenses to keep their data layers up to date. All we need to do is create a style sheet. Are you listening, Duke Energy?
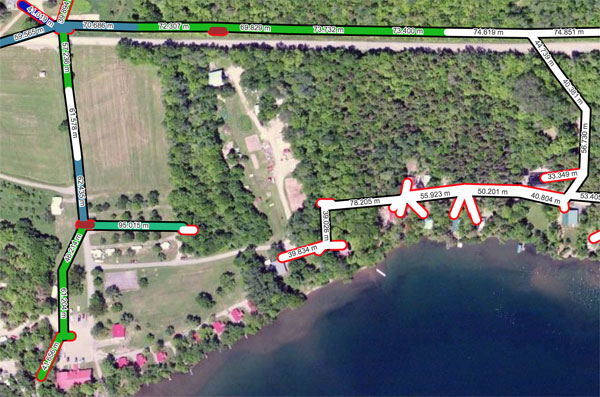
Example of client data showing a dynamically styled thematic map for vegetation management:
We currently provide coverage for states where our existing clients are located and are gradually expanding to other states and counties. If you are interested in Cliffhanger Maps, shoot us a note.